


iRacing
How to Use iRacing Telemetry to Find Faster Lap Times: A Practical Guide
Telemetry analysis is fast becoming a popular way for sim racers to improve their speed and consistency in iRacing. If you are struggling to break through the 3,000 iRating barrier, you may want to consider utilising iRacing’s telemetry recording feature to understand where you’re missing out compared to the quickest drivers. Below, we’ll outline how to record telemetry in iRacing and describe how you can use it to help you become a faster, more consistent sim racer.
What is Telemetry?
Telemetry is by definition the recording and transmitting of data from an instrument, which, in our case, is a virtual racecar.
How To Record Telemetry In iRacing
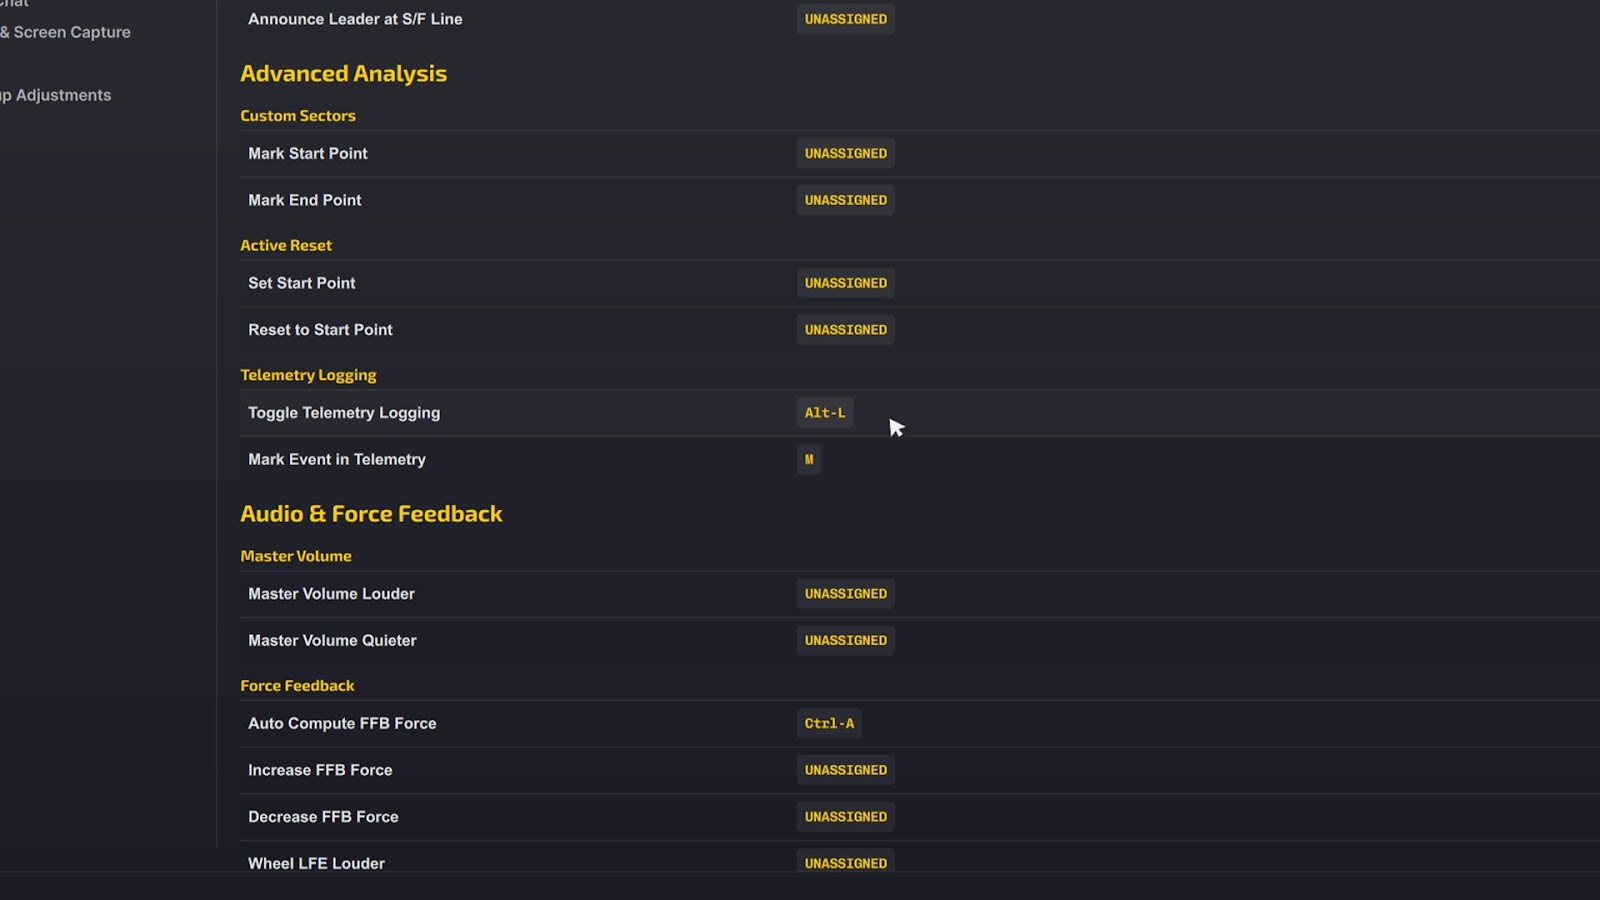
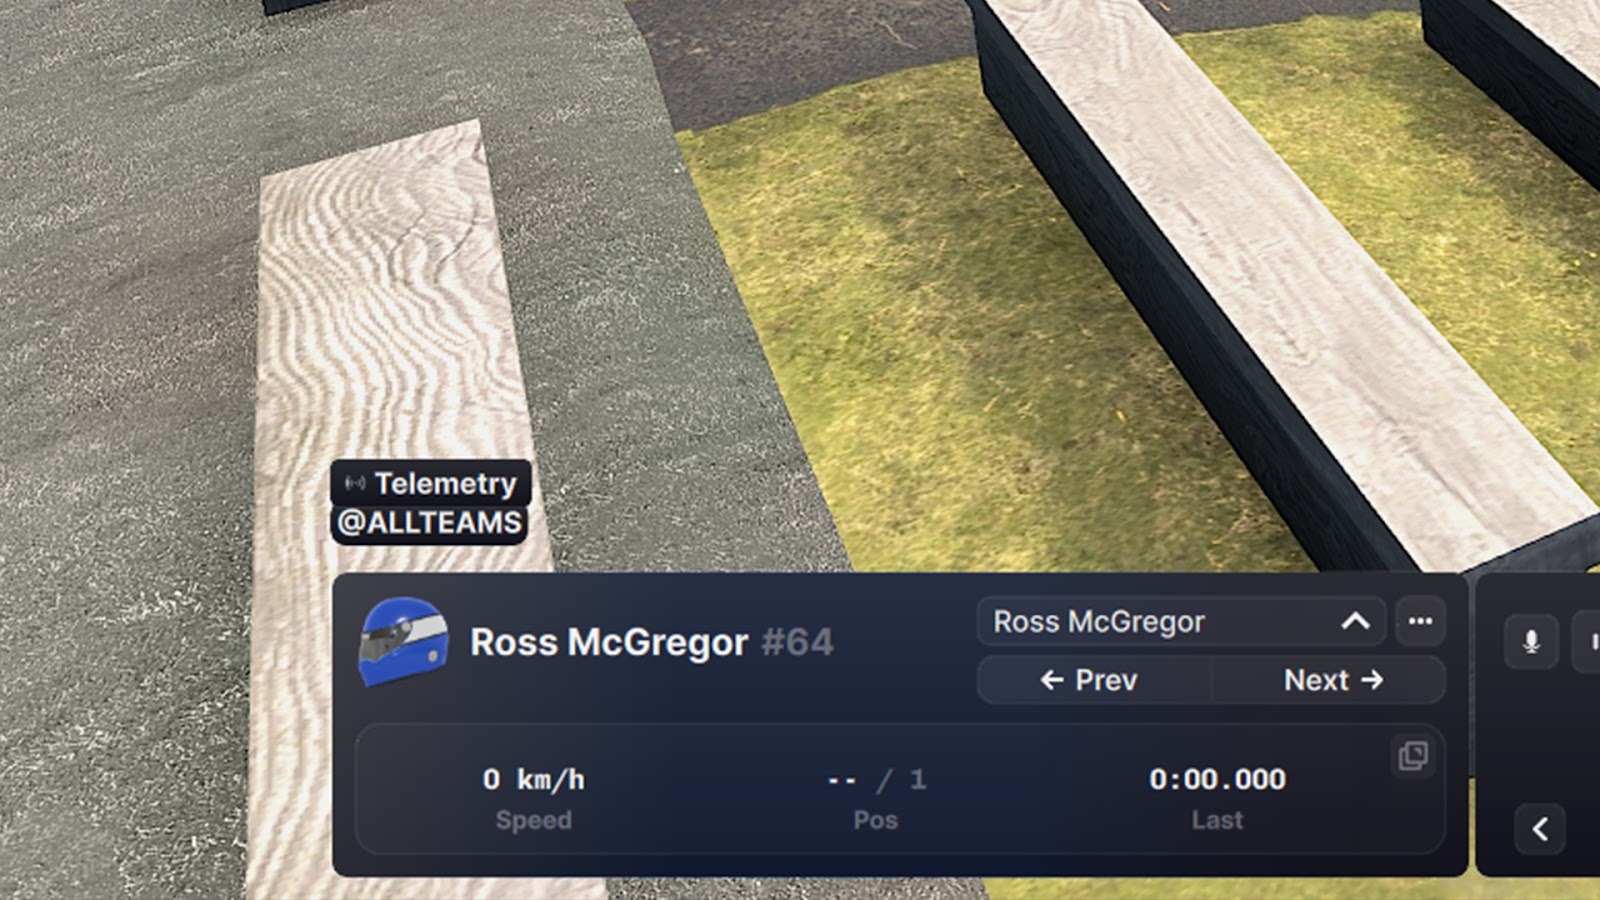
To record telemetry in iRacing, press ALT+L while driving (you can assign a different button if you wish). You will know when this has been activated as the word ‘telemetry’ will appear at the bottom left of your screen.
When you no longer wish to record, you can either press the same key combination again or simply finish the session.
Where Are iRacing’s .ibi Telemetry Files Located?
After recording, your saved .ibi telemetry files are located in Documents/iRacing/telemetry by default.
How Do I Analyze iRacing’s Telemetry Files?
To analyze the iRacing telemetry you have recorded, you will need an application to interpret it. This can be done using free telemetry-reading applications, including MoTeC.
There are many paid programs available, but thanks to a collaboration with British engineering firm Cosworth, iRacing has made a free version of its Pi Toolbox software available to all iRacers.
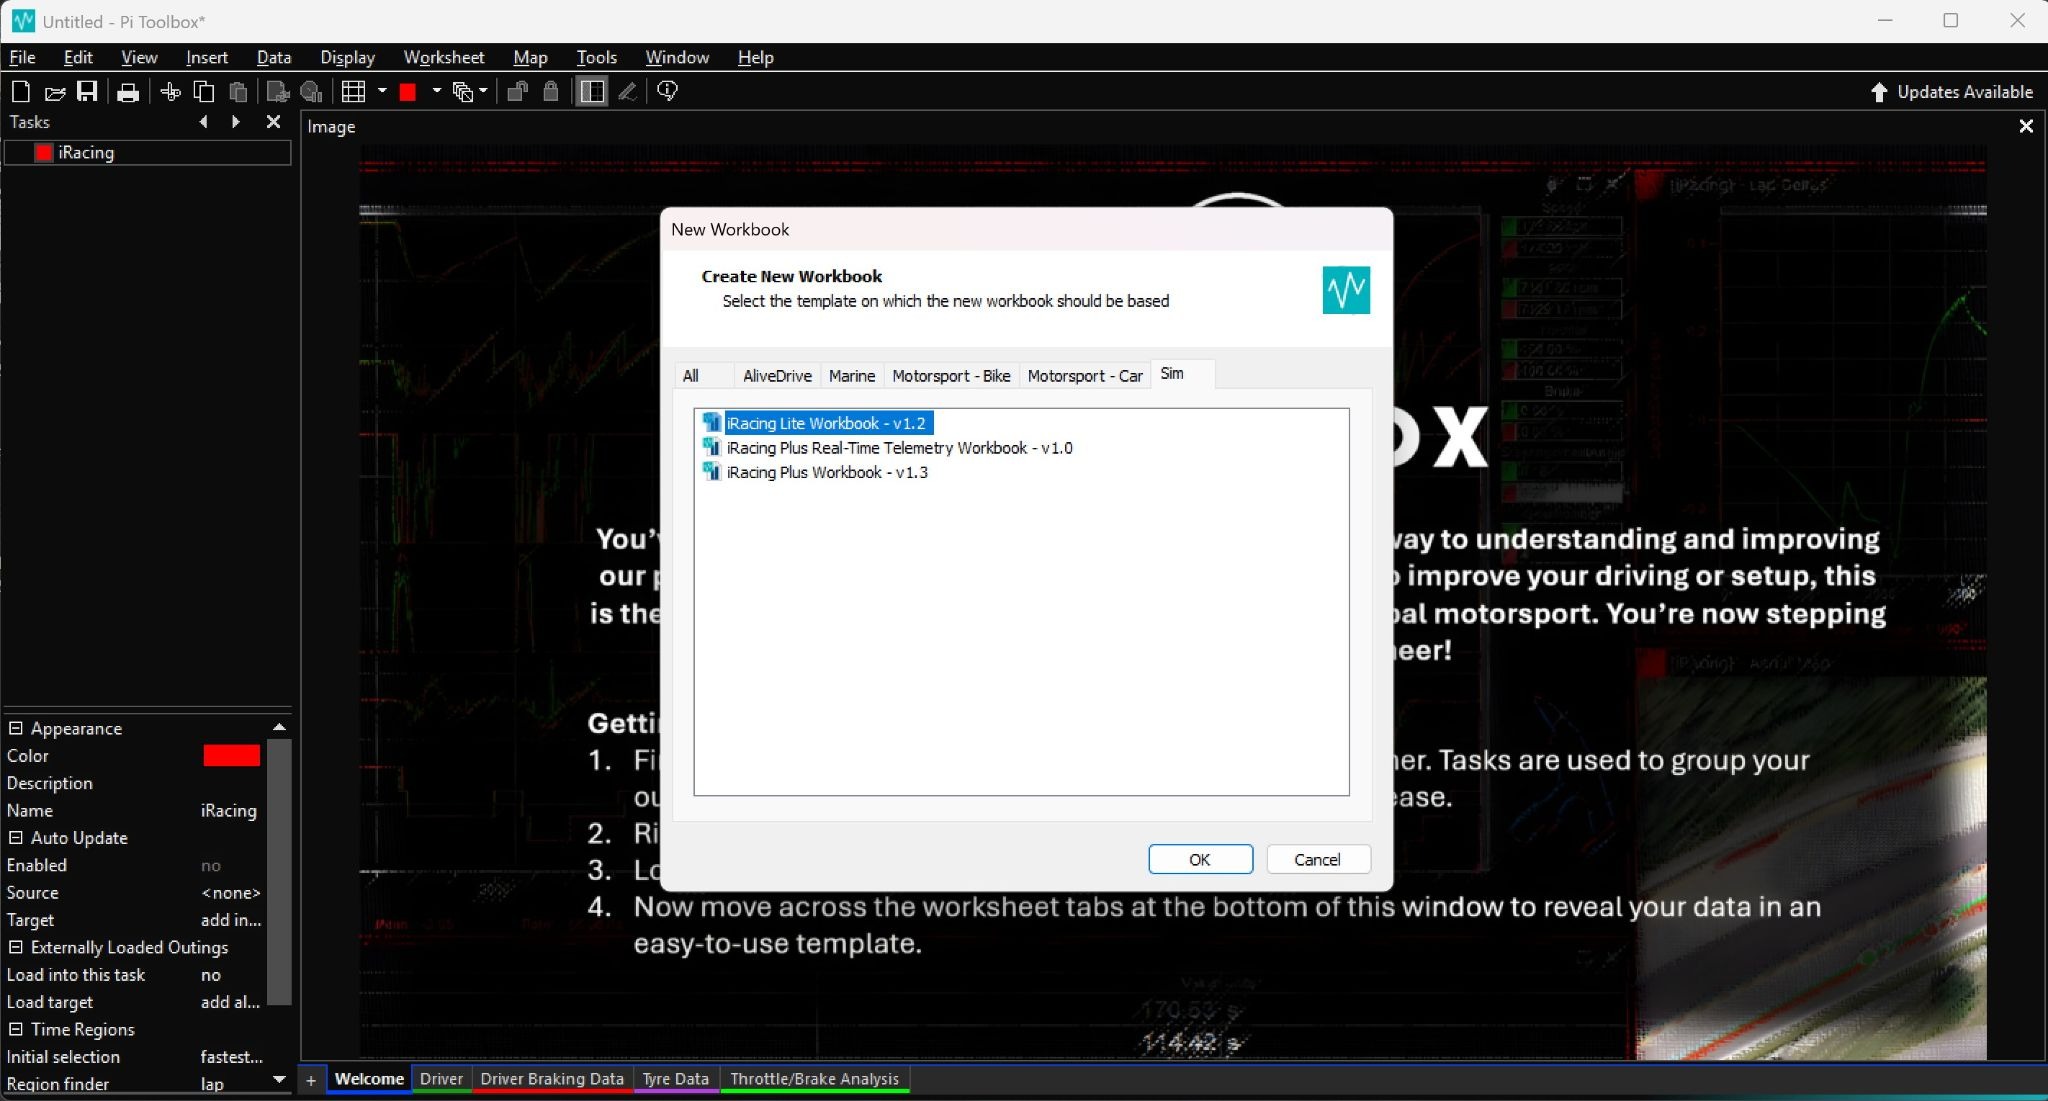
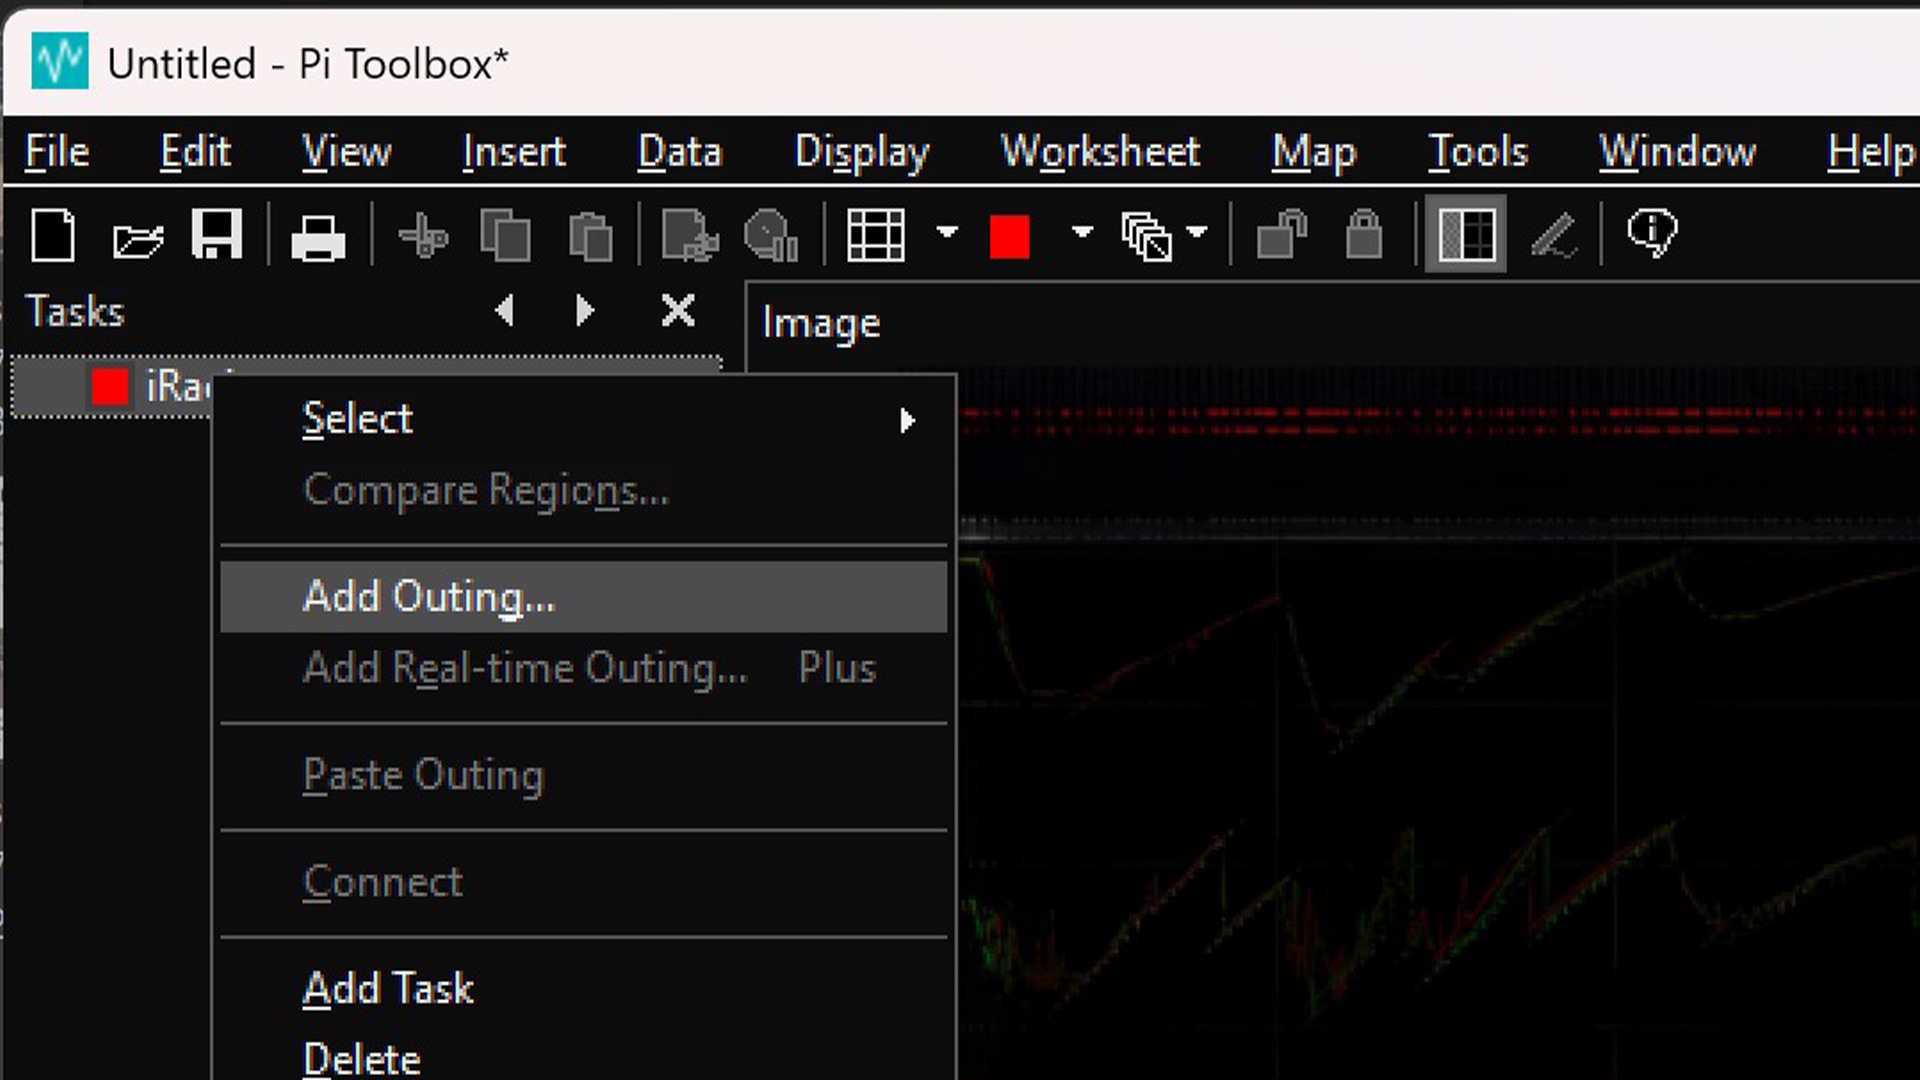
For the purposes of showcasing telemetry, we have used Pi Toolbox to show the basics of reading its data. To add an iRacing .ibi file to this, first create a new ‘iRacing Lite Workbook - v1.2’ file, then right-click on ‘iRacing’ and select ‘Add Outing’.
Here, select your desired .ibi files, and it will duly load into the new workbook. To overlay another driver’s data in the same document, simply add their ‘Outing’ via the same process.
What Are The Main Practical Advantages of Telemetry?
At the most basic level, throttle, brake, and steering-angle traces are powerful facets of evaluating telemetry data. In the example below, the brake trace is marked in red, the throttle is green, and the steering angle is in white.
Other aspects are also shown, including gear number (yellow), speed (purple) and RPM (blue).
Further information is also available under the ‘Tyre Data’ heading, including yaw rate, tyre pressures and tyre temperatures. Using a combination of these, it’s possible to determine where improvements can be made with your driving.
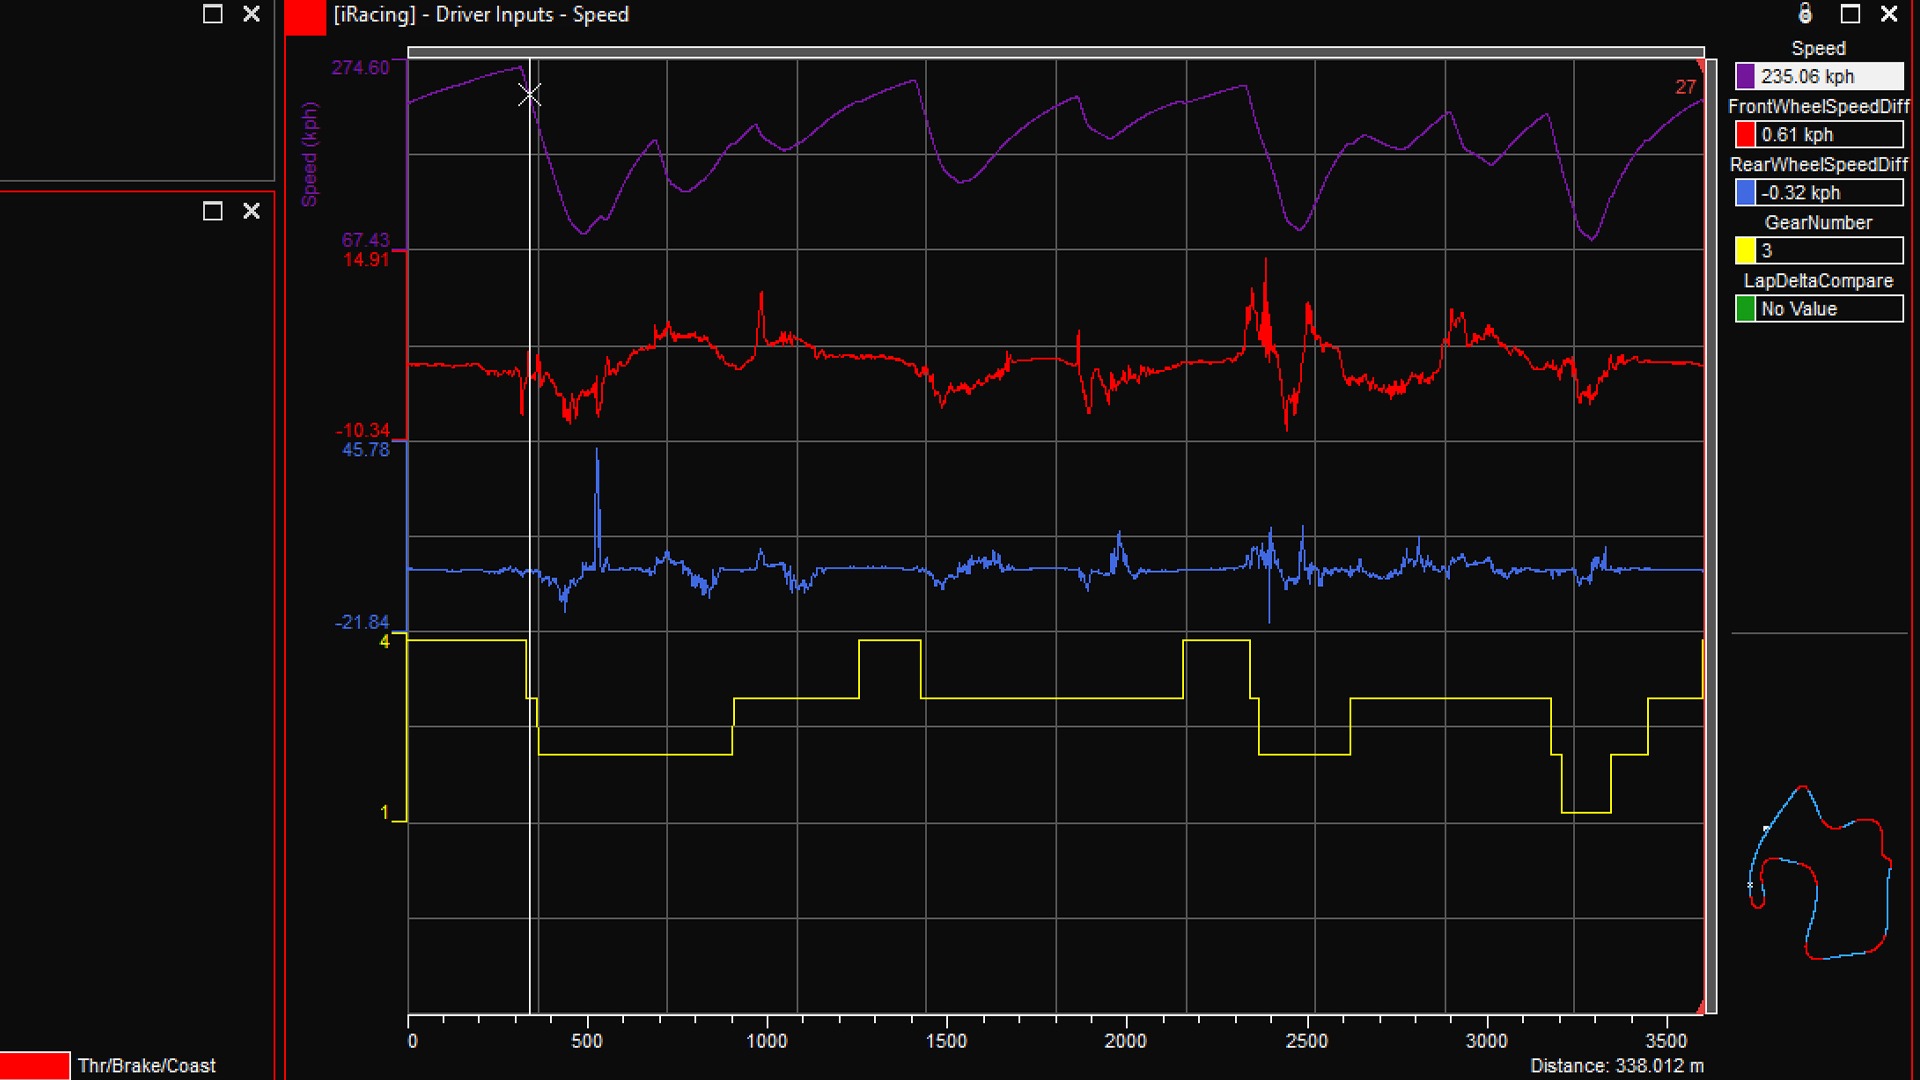
With telemetry traces, you can see how each input is applied and for how long, with an accompanying track map that shows where your car is on the track at any given data point.
Analyzing telemetry is the clearest and most concise way to see where and when your driving can be improved, especially when you overlay your data with a faster driver's.
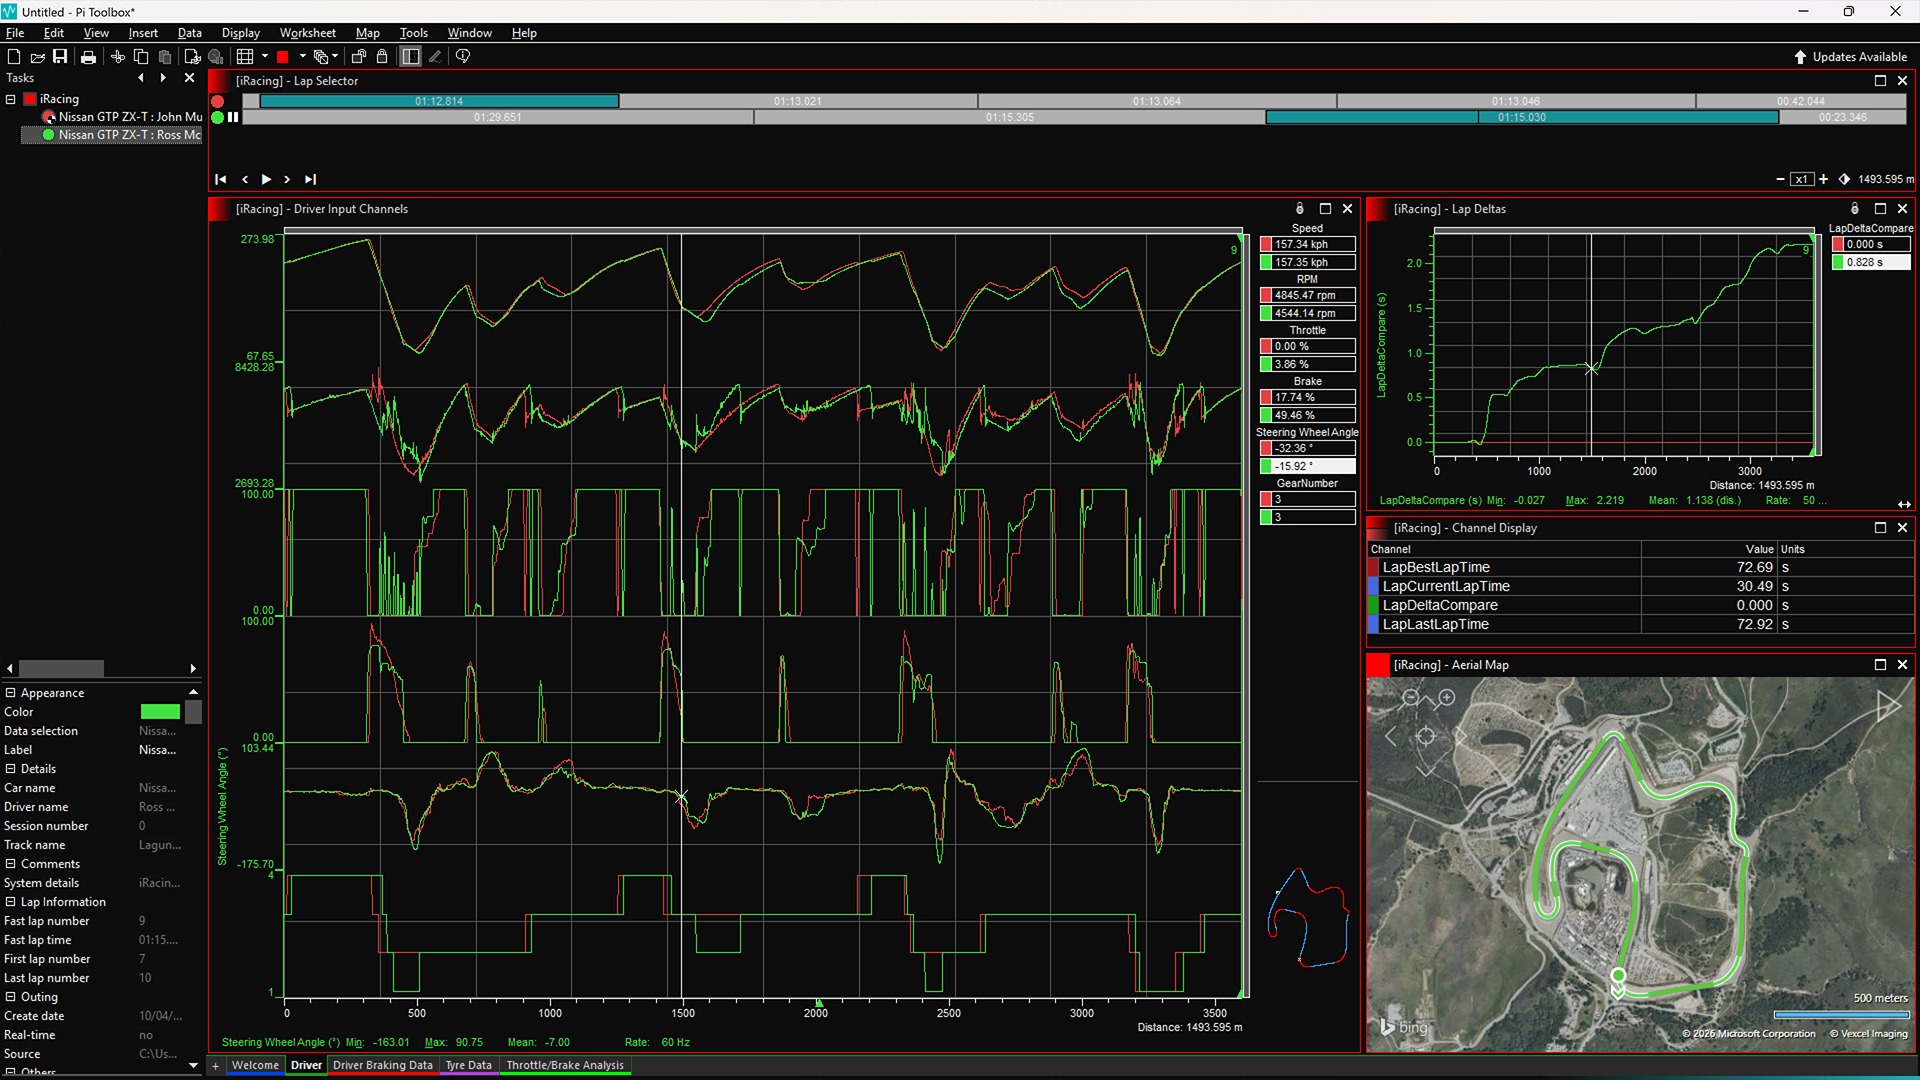
This will highlight even more areas of improvement, as you can see how much earlier or later they apply the brakes and throttle. As you can see in the example below, the green traces for one driver (especially the throttle and brake) are messier and more pronounced than those for the driver shown in red. It’s not always an indication of faster lap times, but in this case, it provides some insight into areas for improvement.
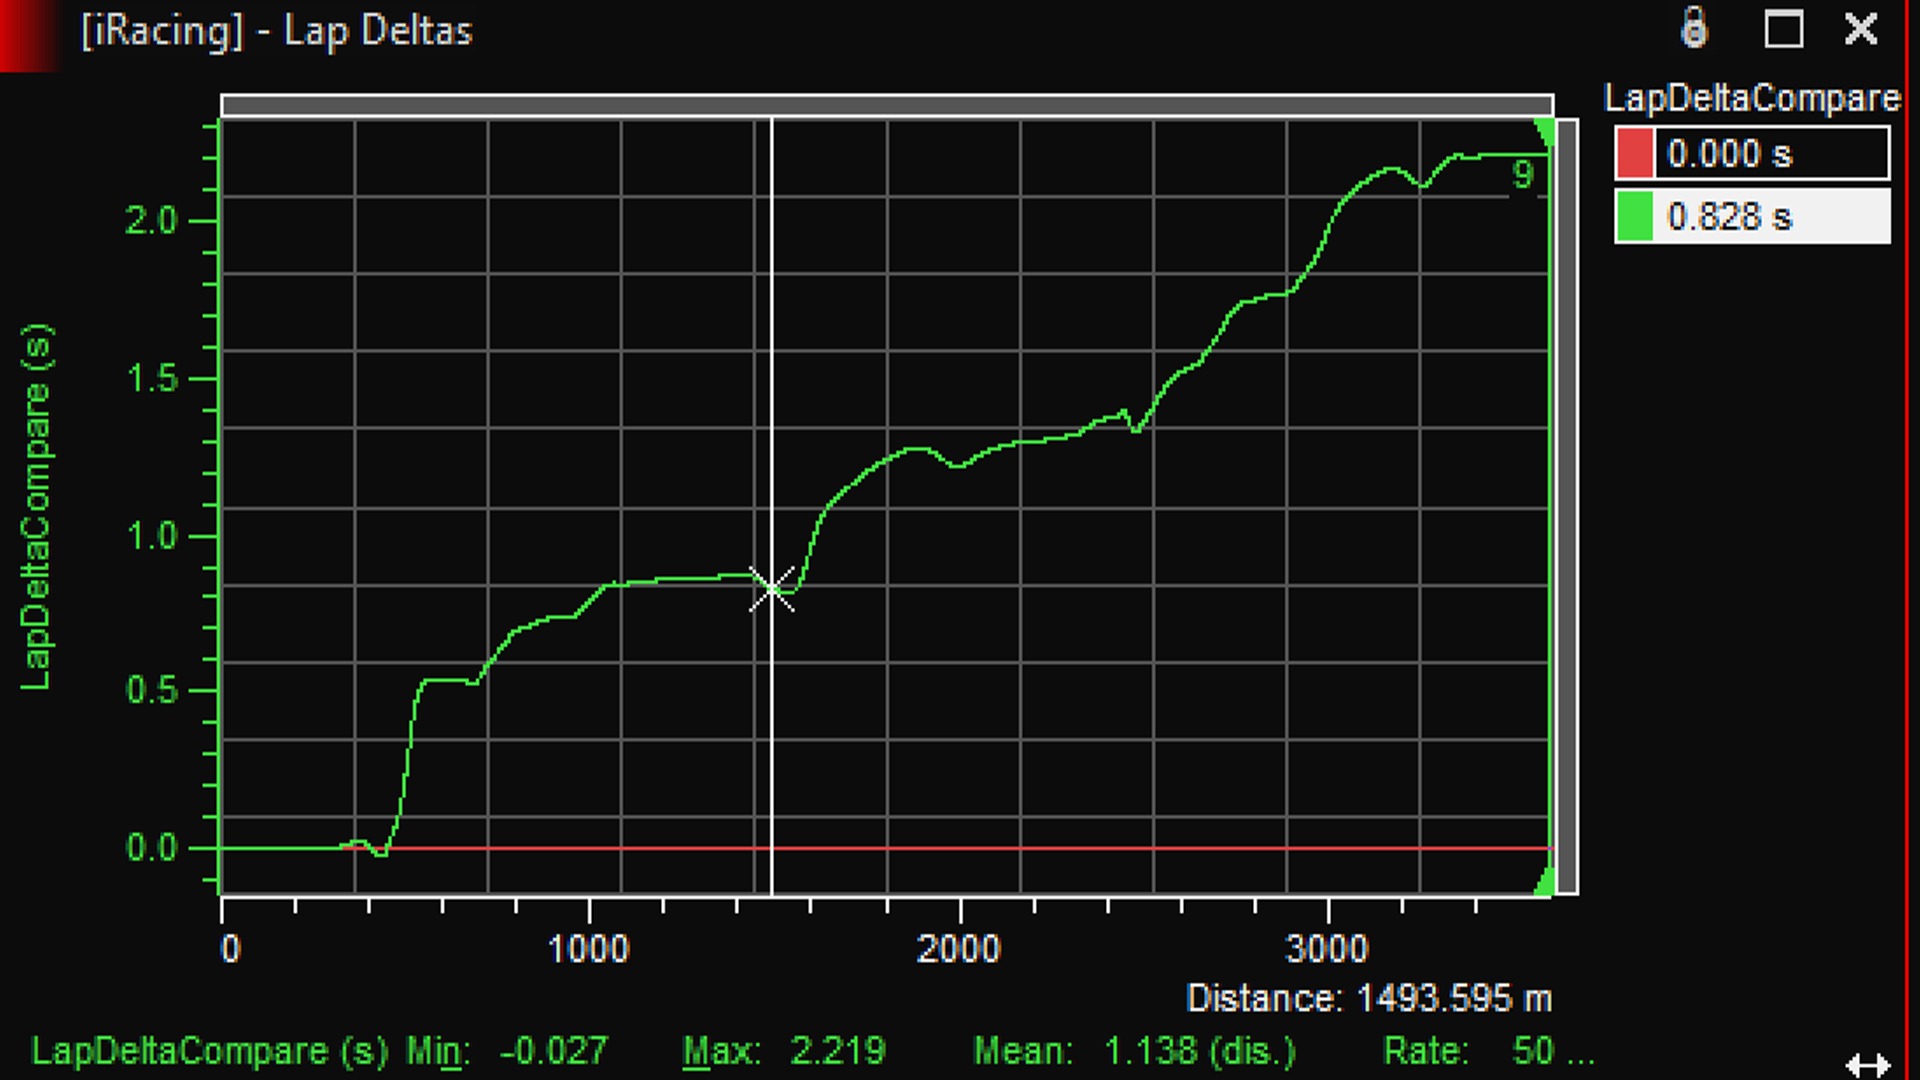
The lap delta graph also gives a clearer indication of where you’re losing time across the lap, for a more general picture of potential gains.
Using more advanced telemetry metrics, you can also compare the driver's racing line, providing a clearer understanding of where lap time can be gained.
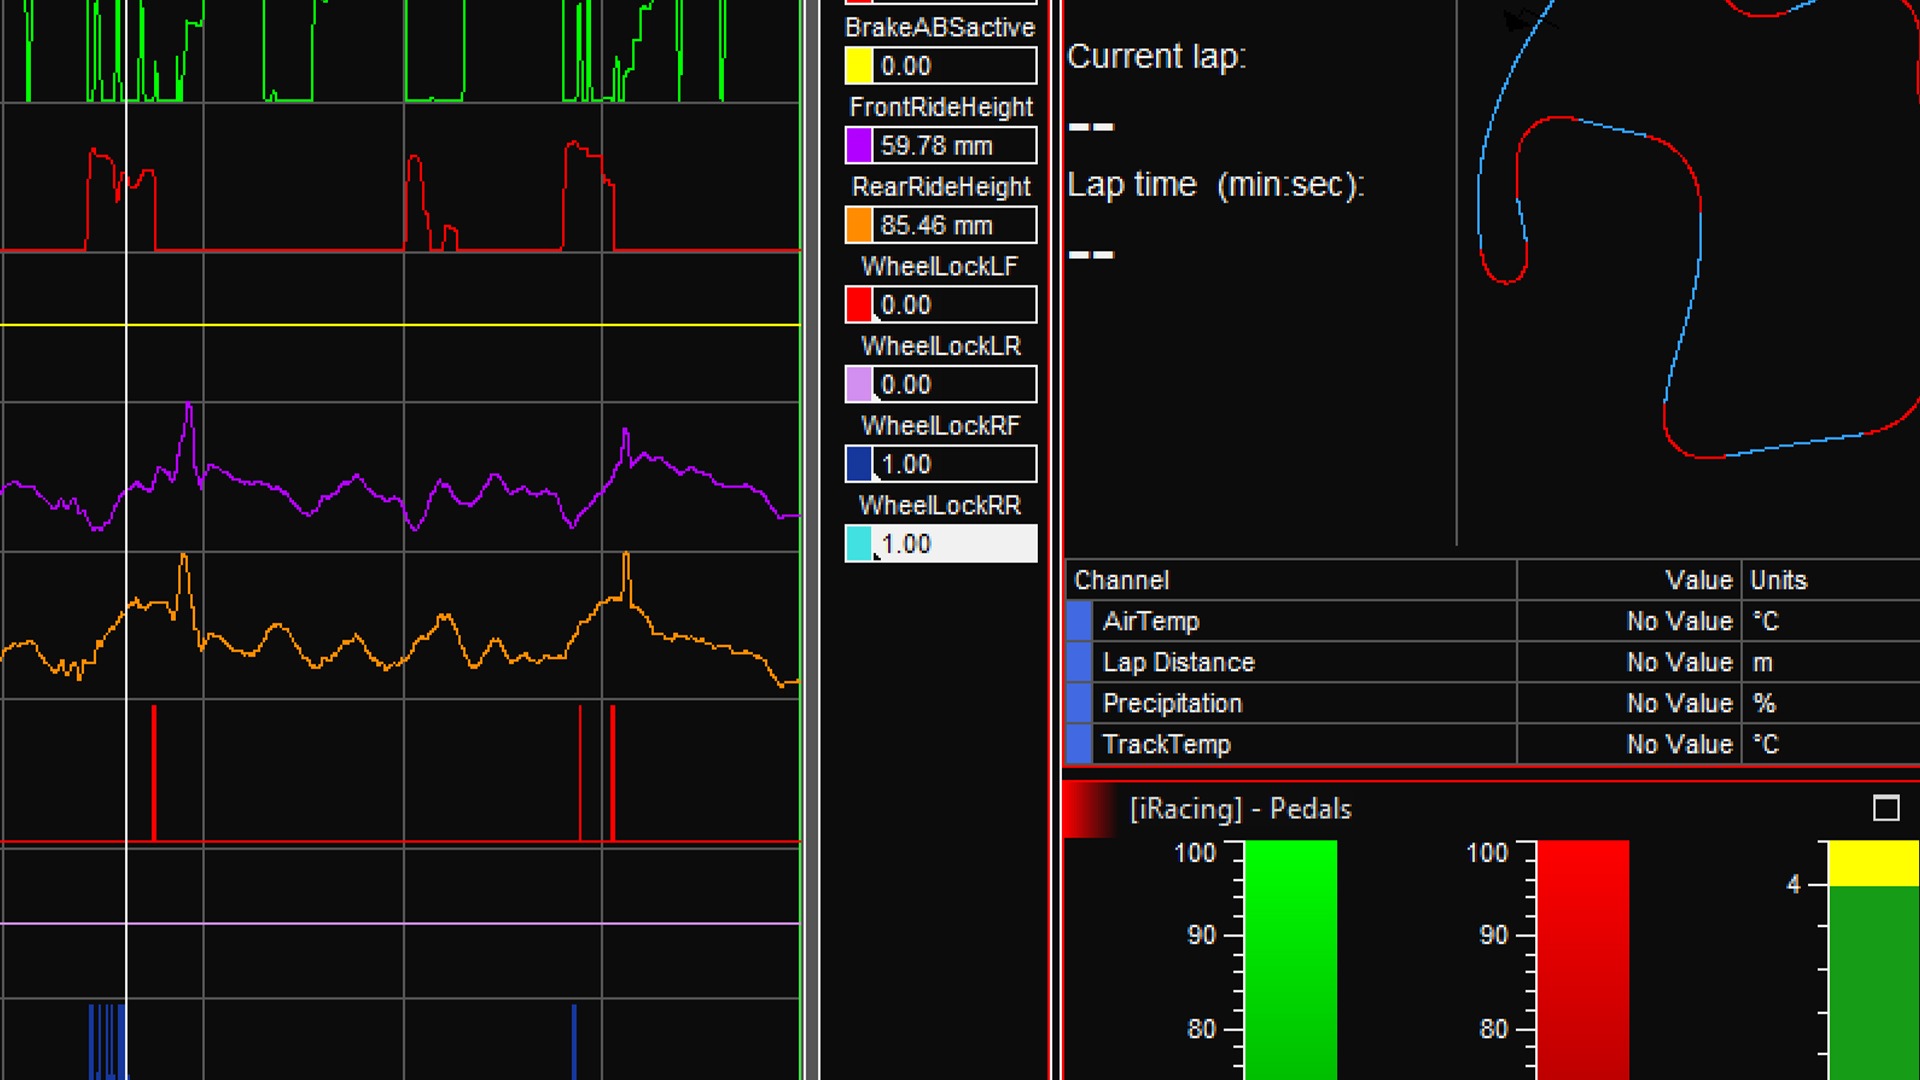
In the most basic tier of Pi Toolbox, it’s also possible to see where you’re applying too much brake pressure, leading to a wheel lock-up. This is denoted in the ‘Driver Braking Data’ tab and shown on the centre-right of the screen (a lock-up is displayed as a ‘1’ value, as opposed to ‘0’).
Setup Analysis Using Telemetry
Telemetry is also useful for performing back-to-back analysis of setups. This way, you can see how much faster your car is through a corner after a setup change, or how its top speed compares (for example, higher wing settings will likely increase corner speeds, but the extra drag will reduce top speeds).
This can be judged alongside more advanced tyre and suspension settings (damper analysis is an area of setup that likely requires its own standalone guide and is a feature of paid-for telemetry analysis tools), with pressure and heat markers that can determine a setup direction regarding camber, caster and toe settings.
Ultimately, for beginner and intermediate drivers who require more detailed telemetry analysis, it’s best to consult a qualified professional. Alternatively, you can try trophi.ai’s iRacing driver coaching tools as part of a free seven-day trial.
Harnessing the power of AI, trophi.ai is an app that monitors your virtual driving and offers real-time, telemetry-influenced suggestions to help you become a faster, more consistent sim racer.
trophi.ai’s telemetry analysis is tailored toward drivers rather than engineers, offering an overall view of on-screen steering, brake, and throttle inputs, including a direct comparison with a top-tier racer’s data.
You can sign up for the free trial today.
Written by the teams at trophi.ai and Traxion.GG.